Ditch Excel: what actually breaks when your portfolio grows past two properties
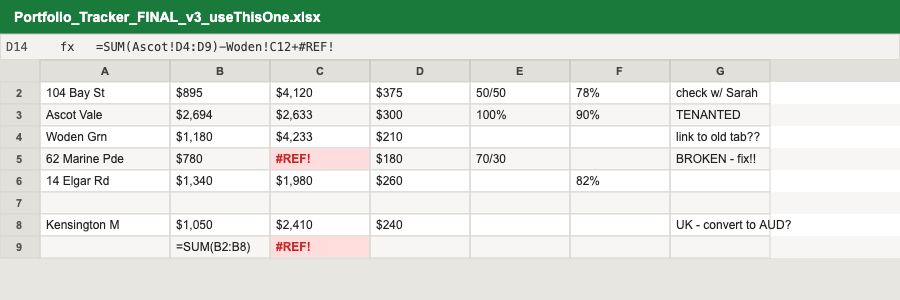
Every investor’s first portfolio tool is a spreadsheet, and for one property, it works fine. The trouble starts at property two, when a second tab needs to talk to the first: a shared offset account, a joint LVR, a combined tax position. By property three, most spreadsheets are held together with hardcoded cell references nobody wants to touch.
None of this is a skill problem. It is a tool problem. Spreadsheets are built for calculation, not for modelling a portfolio that has owners, structures, loans, and a forecast that all need to update together when one number changes.
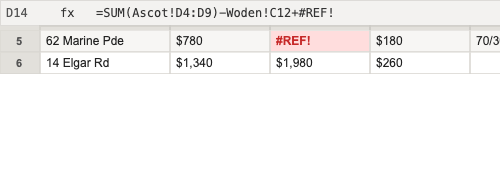
Three specific things break first:
- Ownership math. A property split 70/30 between a trust and an SMSF does not divide cleanly across a flat spreadsheet grid.
- Forecast drift. Manually updating a 10-year projection every time a rate or rent changes means it is stale within a month.
- Actuals vs. plan. Spreadsheets rarely keep last year’s assumptions next to this year’s real numbers, so nobody can see where the plan was wrong.
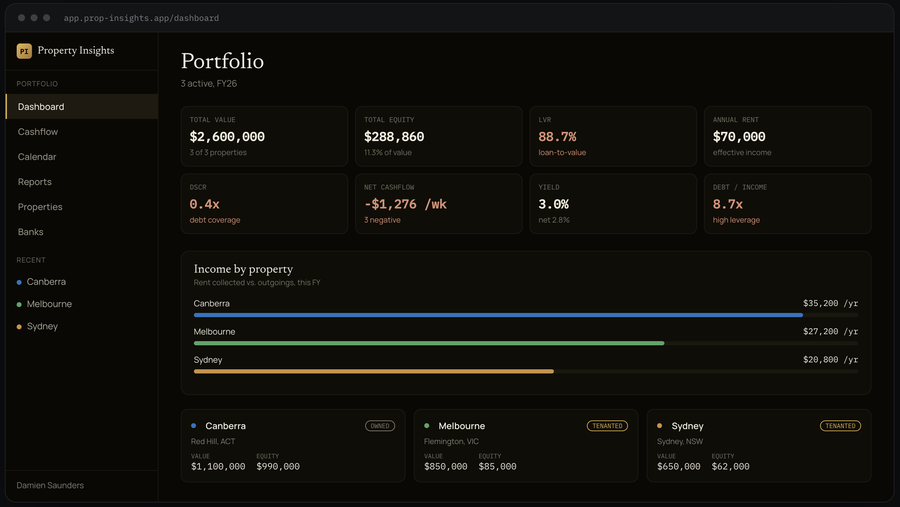
A structured model handles all three by design: every property already knows its owners, its structure, and its forecast, and actuals sit right next to the plan they are measured against. You are not building the tool anymore, you are just using it.